Friday, June 20, 2014

Saint Paul's oversized downtown streets

IMAG0168
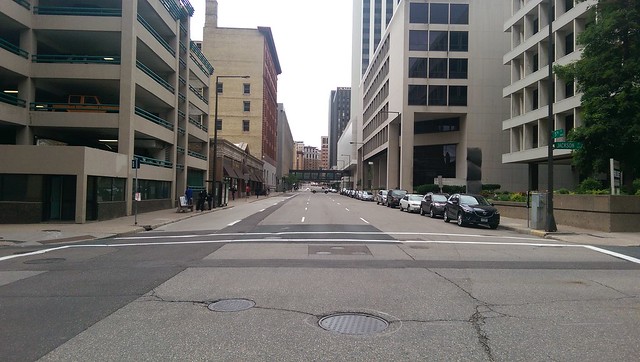
5th Street in downtown Saint Paul, noon on a Thursday.

If you grew up in Minnesota, you may have heard the story of Saint Paul's narrow streets—In downtown, the streets were so tight that the city eventually decided to shave off the fronts of buildings downtown, in order to make the streets wider.

Today, however, many of downtown Saint Paul's streets are too wide, or at least they grant way more space to cars than what is actually needed. Here's a map I made of streets in the area that appear to be wider than necessary to handle the amount of traffic they see (orange means roughly one lane too wide, red means roughly two lanes too wide):


View Oversized downtown St. Paul streets in a larger map

The new Green Line is hoped to be a new big economic driver for Saint Paul, but to maximize the benefit, we have to make sure that the areas around stations—and throughout the city—are built for people and not just the movement of cars. Sidewalks need to be widened, bike lanes need to be added, and bus lanes need to be retained and improved, including upgrading bus stops that are often put in tight spaces (especially the one on 6th Street at Cedar Street).

Personally, I like the idea of converting 5th Street to a (bus) transit/pedestrian mall with bi-directional bus traffic, since it connects directly to West 7th Street and the I-94 ramps to/from Minneapolis, links Rice Park and Mears Park, and also goes straight past the Green Line's Central station and is just one block from Union Depot. Large chunks of 5th and 6th are about twice as wide as they need to be for the amount of car traffic they see, so they could be combined into a two-way street for cars on 6th. I'm not sure which street would be better off with bike facilities—in this concept, 5th would probably be more comfortable for many riders. Buses are big vehicles, but there are far fewer of them than cars (combined, the 5th and 6th street bus lanes now appear to carry a bit over 1,000 transit buses per day).

Minnesota Street should really become a two-way, as should the stretch of Cedar Street south of 5th. Jackson Street could become a two-way (probably in addition to Sibley Street, even though that's relatively appropriately sized when the amount of on-street parking is considered). Jackson and Sibley each narrow down to just two lanes as they reach Shepard/Warner Road, so it doesn't make much sense for them to be wider to the north. Jackson is ridiculously wide north of 7th Street (a segment where it is a six-lane two-way), and really needs a major overhaul to convert it to a more pleasant space rather than a river of concrete.

There's a potential to re-make downtown Saint Paul to be a much more walkable/bikeable space. There are pockets of great spaces in the area, but the streets need work to link those places together to really revive the streets.

Friday, June 6, 2014

Validating Green Line travel time estimates

green-line-sim-full-accel

Following my post last week, Bill Lindeke posted a comment which he summed up as, "What is the theoretical shortest possible run time for the Green Line?"

That's a really good question, since it sets a guidepost for what can realistically be achieved from changing signal timing along the route, and helps us to understand the assumptions that planners of the line originally made.

Of course, the answer depends on exactly how theoretical you want to get. I decided to do a simple simulation based on what speed limit signs I could see along the route. I had started taking attention of them a few months ago as they went up, but spent a few evenings this past week trying to verify the information I already had and to add more to it. Unlike roadways where you typically have a single speed limit over great distances, rail lines tend to have special speed limits for each curve, junction, and other special areas. I also made an assumption that station stops would average 20 seconds.

The main leg of the Green Line along University Avenue is mostly set at 35 mph, though there is a curve at Fairview avenue set for 25. Other curves on the line are mostly set at 10 or 15 mph. Cars and trucks tend to naturally slow at sharp turns, but they move through pretty quickly. The slower speeds that trains take through bends tend to be more pronounced, since the trains themselves are often a lot longer than the curve itself.

As seen in my graph above, it looks like a train could make the run from Target Field to Union Depot in under 38 minutes if it wasn't encumbered by signals. That includes downtown Minneapolis—my simulation had the train crossing from Target Field to Downtown East station in under 5 minutes, or about 3 minutes faster than the Blue Line is scheduled to take today. That instance also assumed that the LRV operators were extremely good at starting and stopping their trains, starting to decelerate at the precise moment needed to hit the platform dead-on. In the interest of safety, a 38-minute end-to-end time while making all stops should probably remain theoretical.

I did take one step beyond, looking at what might happen if there was an "express" version of the Green Line, which only ran end-to-end, making zero intermediate stops. Here's the result:

green-line-sim-express

28 minutes from end to end, if you had an operator with nerves of steel and didn't get held up by signals or other traffic. I've heard people ask about express trains on the Green Line in the past, and have tended to brush it off as an unwise idea. According to these two charts, it might be possible to save 10 minutes on the trip, but the complexity of switching from track to track to pass other trains would make it very vulnerable to delay, and would probably have a negative impact on regular trains. They'd also have to run pretty often in order to get benefit from that 10-minute time savings. Running express traffic only every half hour, for instance, would probably be a net loser all around.

Here's another graph where I attempted to be a bit more realistic, assuming that train operators would only accelerate and decelerate their trains at 50% of the maximum (full service acceleration/deceleration is 3.0 mph per second, though emergency braking is greater). The result was a run time of 41 minutes, which sounds pretty familiar:

green-line-sim-50pct-accel

Based on that and my first graph, it seems that planners of the Green Line expected some very strong signal coordination, priority, or preemption (whatever word you want to put on it), allowing trains to travel with a minimal amount of delay. I believe it's fairly customary to set schedules around a simulated time based on best-case travel time, plus a fudge factor of 10% or so. Of course, in this case, any fudge factor mostly gets eaten up just by delay in downtown Minneapolis (where there hasn't been any signal coordination for the Blue Line, as far as I can tell).

There are several things that may be different as built in the real world compared to how they were originally set up in computer models for making estimates. It seems pretty likely that that the three stations added to the line late in the process (Hamline, Victoria, and Western in Saint Paul) weren't included in the planners' simulations. That probably contributes to about one and a half minutes of extra time with the way I set things up. I also seem to remember that the Washington Avenue Bridge was originally going to allow trains to go relatively fast (perhaps 45 mph), but as far as I can tell, it's limited to 25 mph for trains. There may be other changes along the route that were never put into the schedule simulations.

Finally, since this all involved calculating stopping distance, I'll make a note about safety around light-rail vehicles—assuming a 2-second reaction time and normal braking, it takes 400 feet for a 35-mph train to stop, or 2/3rds of a long block along University Avenue. Even with emergency braking, it could take 280 feet or more for a train to come to a halt, so keep your eyes open when visiting the Green Line.