
Following my post last week, Bill Lindeke posted a comment which he summed up as, "What is the theoretical shortest possible run time for the Green Line?"
That's a really good question, since it sets a guidepost for what can realistically be achieved from changing signal timing along the route, and helps us to understand the assumptions that planners of the line originally made.
Of course, the answer depends on exactly how theoretical you want to get. I decided to do a simple simulation based on what speed limit signs I could see along the route. I had started taking attention of them a few months ago as they went up, but spent a few evenings this past week trying to verify the information I already had and to add more to it. Unlike roadways where you typically have a single speed limit over great distances, rail lines tend to have special speed limits for each curve, junction, and other special areas. I also made an assumption that station stops would average 20 seconds.
The main leg of the Green Line along University Avenue is mostly set at 35 mph, though there is a curve at Fairview avenue set for 25. Other curves on the line are mostly set at 10 or 15 mph. Cars and trucks tend to naturally slow at sharp turns, but they move through pretty quickly. The slower speeds that trains take through bends tend to be more pronounced, since the trains themselves are often a lot longer than the curve itself.
As seen in my graph above, it looks like a train could make the run from Target Field to Union Depot in under 38 minutes if it wasn't encumbered by signals. That includes downtown Minneapolis—my simulation had the train crossing from Target Field to Downtown East station in under 5 minutes, or about 3 minutes faster than the Blue Line is scheduled to take today. That instance also assumed that the LRV operators were extremely good at starting and stopping their trains, starting to decelerate at the precise moment needed to hit the platform dead-on. In the interest of safety, a 38-minute end-to-end time while making all stops should probably remain theoretical.
I did take one step beyond, looking at what might happen if there was an "express" version of the Green Line, which only ran end-to-end, making zero intermediate stops. Here's the result:
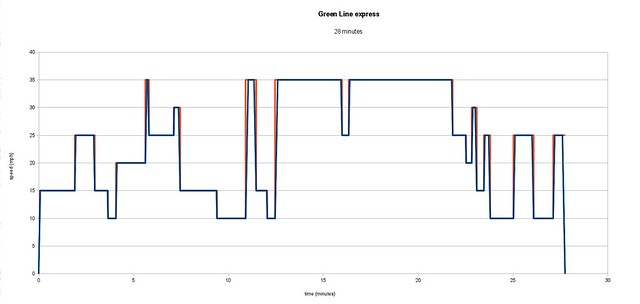
28 minutes from end to end, if you had an operator with nerves of steel and didn't get held up by signals or other traffic. I've heard people ask about express trains on the Green Line in the past, and have tended to brush it off as an unwise idea. According to these two charts, it might be possible to save 10 minutes on the trip, but the complexity of switching from track to track to pass other trains would make it very vulnerable to delay, and would probably have a negative impact on regular trains. They'd also have to run pretty often in order to get benefit from that 10-minute time savings. Running express traffic only every half hour, for instance, would probably be a net loser all around.
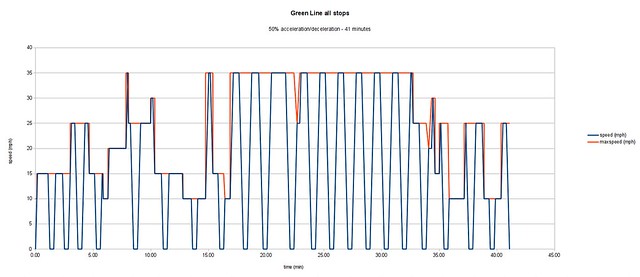
Here's another graph where I attempted to be a bit more realistic, assuming that train operators would only accelerate and decelerate their trains at 50% of the maximum (full service acceleration/deceleration is 3.0 mph per second, though emergency braking is greater). The result was a run time of 41 minutes, which sounds pretty familiar:
Based on that and my first graph, it seems that planners of the Green Line expected some very strong signal coordination, priority, or preemption (whatever word you want to put on it), allowing trains to travel with a minimal amount of delay. I believe it's fairly customary to set schedules around a simulated time based on best-case travel time, plus a fudge factor of 10% or so. Of course, in this case, any fudge factor mostly gets eaten up just by delay in downtown Minneapolis (where there hasn't been any signal coordination for the Blue Line, as far as I can tell).
There are several things that may be different as built in the real world compared to how they were originally set up in computer models for making estimates. It seems pretty likely that that the three stations added to the line late in the process (Hamline, Victoria, and Western in Saint Paul) weren't included in the planners' simulations. That probably contributes to about one and a half minutes of extra time with the way I set things up. I also seem to remember that the Washington Avenue Bridge was originally going to allow trains to go relatively fast (perhaps 45 mph), but as far as I can tell, it's limited to 25 mph for trains. There may be other changes along the route that were never put into the schedule simulations.
Finally, since this all involved calculating stopping distance, I'll make a note about safety around light-rail vehicles—assuming a 2-second reaction time and normal braking, it takes 400 feet for a 35-mph train to stop, or 2/3rds of a long block along University Avenue. Even with emergency braking, it could take 280 feet or more for a train to come to a halt, so keep your eyes open when visiting the Green Line.
No comments:
Post a Comment